ALI LIN
← IndexAli Lin

TEARDOWN № 1

an instrumented teardown of a generative image API

measurement harness + interactive reportTypeScript / React / fal API2026shippedopen live ↗

An API's documentation tells you what it returns. Only measurement tells you what it withholds.

the instrument from the index, in detail · drag to lean around it, click to run the gears · loads on click

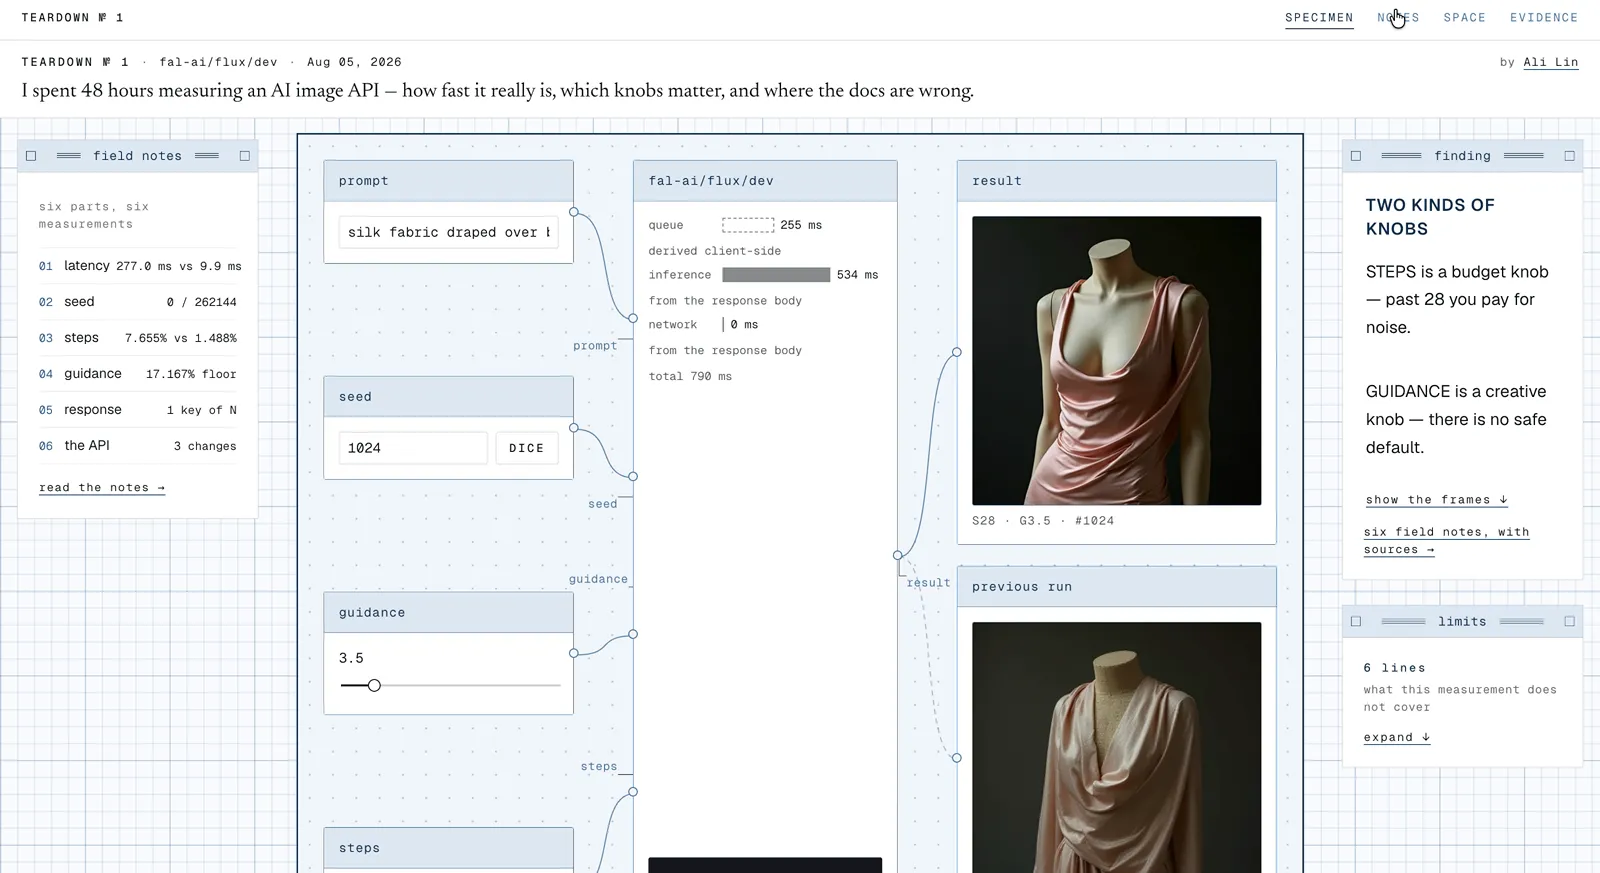
inference533 msσ 9.9queue250.5 msσ 277.0network0 msσ 0.5dashed = not returned by the API, and where the variance livesqueue σ 277.0 ms against inference σ 9.9 ms
where the milliseconds go · queue, the segment the API doesn't return, holds the variance · FIG A · p50 across N=20 at S28, 512×512 · e4-latency/stats.md:11-13

WHAT

AI image APIs ship faster than anyone measures them. Latency claims are marketing, parameter documentation is partial, and the numbers that matter to a production integrator: where the milliseconds live, what a knob actually buys, whether the same call returns the same bytes: are published nowhere.

I spent 48 hours instrumenting one model, fal-ai/flux/dev, through its synchronous endpoint: 47 structured calls across five experiments, every measurement logged to disk, every claim traceable to a source file and line. The result is not a benchmark. Benchmarks answer "which is better." A teardown answers "what is actually happening inside", and what the API knows but does not send.

Three questions an integrator cannot answer from the docs:

WHERE DOES THE TIME GO. The response body returns one timing field, inference. Queue time, the segment between sending a request and the model starting work, is not returned and must be derived client-side.

WHAT DOES A PARAMETER BUY. num_inference_steps documents a default of 28 and no range. Nothing states what an additional step changes, or costs.

IS THE SAME CALL THE SAME IMAGE. Determinism is assumed, never stated. Caching and reproduction strategies depend on it.

HOW

A BROWSER-BASED HARNESS

A browser-based harness making live calls through a proxy, timing each with performance.now() split into queue / inference / network, logging every call to a structured record. Image comparison by per-channel pixel diff at two declared thresholds, any Δ and Δ>32 of 255, because "how many pixels changed" and "how many changed visibly" are different questions with different answers.

FIVE EXPERIMENTS

Five experiments: a steps sweep (10 rungs, 1→45), a guidance sweep (8 rungs, 1→20), a seed determinism run (3 identical calls, byte comparison), a latency series (N=20 at fixed parameters), and a friction log of every gap between the documentation and the wire.

five experiments, 47 structured calls
the five experiments placed where they were taken · drag to turn the volume, select one to isolate it · the friction log has no coordinate, so it shows as the volume itself

THE FIT

Inference time against steps, ten rungs, with the residual given twice so the caption below can be checked rather than taken.

03006009001248121620283645stepsstepsinference_msΔ msΔ % of measured131.9+17.4+54.5224.5−9.5−38.9462.4−10.7−17.18153.8+2.6+1.712239.4+10.2+4.216318+10.7+3.420368.8−16.6−4.528520.2−21.4−4.136711.6+13.9+2.045877+3.6+0.4y = 19.52x − 5.0 · R² 0.9978 · N=10
FIG B · ten measured points, 1 to 45 steps · linear fit y = 19.52x − 5.0, R² 0.9978Δ from fit given twice: absolute ms, and as a share of the measured valuebelow S8 the fit misses by 17 to 55 percent of the measurementfrom S8 up it holds within 5 percentR² is carried by the high rungs. The low rungs are not described by this line. · e4-latency/stats.md:20-35

FINDINGS

LIMITS

  • N=1 per rung, single region, single day, no residual-to-reference series, so no convergence claim is made.
  • Each finding closes with a build note on the page: cache on the parameter tuple, budget steps before anything else, size timeouts from the segment you have to time yourself.

MORE

The report is laid out as an engineering desktop: a ruled notebook ground, opaque paper surfaces, and the API itself rendered as a node graph: inputs wired into the model, the model wired into its results. The teardown convention is literal: every part pulled out, labelled, and measured, with the latency anatomy drawn inside the model node where the call actually happens.

Instrument-building over tool-using: the harness, the pixel-diff tooling, and the verification pipeline are all first-party. Claims survive audit: every number on the site carries its source file, line, sample size, and threshold, and the raw files ship with the report. Limits are stated by the author, not discovered by the reader: N=1 per rung, single region, single day, no residual-to-reference series, so no convergence claim is made.

TEARDOWN № 1 is the first in a series. The method, sweep and diff and time and log and publish with sources, ports to any inference API. The findings do not: they are one model, measured.

Ali Lin, design engineer